


Bitcoin fell with the technology sector, on the same days, for the same reason. Whatever else it may be, it is currently trading as a risk asset.
The speed of the recent correction surprised almost everyone. Below we work through what actually drove it, what the on-chain measures suggest about value, and where the historically significant levels sit — with the caveat that none of this constitutes financial advice.
Why Bitcoin Is a Risk Asset
The clearest way into this is a chart with three lines on it. The orange line tracks Cathie Wood's Ark Innovation Fund — the archetypal holder of unprofitable technology companies whose value rests on earnings projected years out. The green-red line is Bitcoin. The blue-green line is the two-year Treasury yield.
Note when the relationship tightened. The correlation was not always this strong — it became so once interest rates began moving in earnest. Both assets had been drifting lower since March; both broke down sharply in November, after the Fed shifted position.
Companies in a fund like Ark need money to be cheap. Their profits sit far in the future, and a valuation model discounts those future profits back to the present using a rate that includes the risk-free rate. When that rate rises, the present value of distant earnings falls — arithmetically, not sentimentally. Higher rates also tighten liquidity, and tight liquidity makes every risk asset less attractive at once.
Bitcoin is not a corporation, and many serious people classify it as a currency or a commodity closer in character to gold. That may well be right about what it is. It is not currently right about how it trades.
Bitcoin has become an instrument held by macro investors and large hedge funds, who treat it as one risk position among several. When those desks reduce exposure to technology, the Bitcoin position is reduced in the same motion. Price action today is driven by macro conditions rather than by anything specific to the asset.
What the Market Expects from the Fed
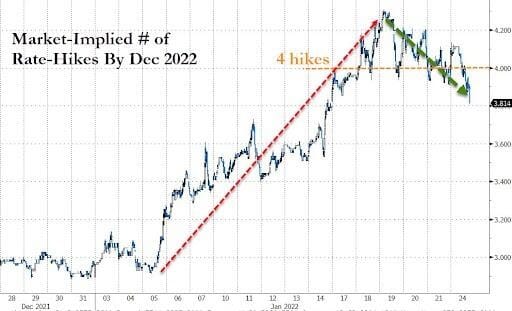
Market pricing had reached roughly 4.25 to 4.3 rate hikes by year-end. Since volatility rose a week and a half ago, that expectation has been falling quickly.
There is a pattern here worth understanding. Over the past forty years, a sufficiently severe market decline has tended to alarm government and central bankers into cutting. It follows that the further markets fall, the lower the probability of further hikes — which in turn relieves pressure on precisely the assets that fell.
Risk assets are, in part, waiting for conditions bad enough to force a policy reversal. That is not a comfortable thing to be positioned around, but it explains why bad economic news is sometimes met with a rally.
Realized Value and the Historic Floor
The natural question is whether this is a buying opportunity. One useful frame comes from the realized value measure — work here from Deep Dive, who do it well.
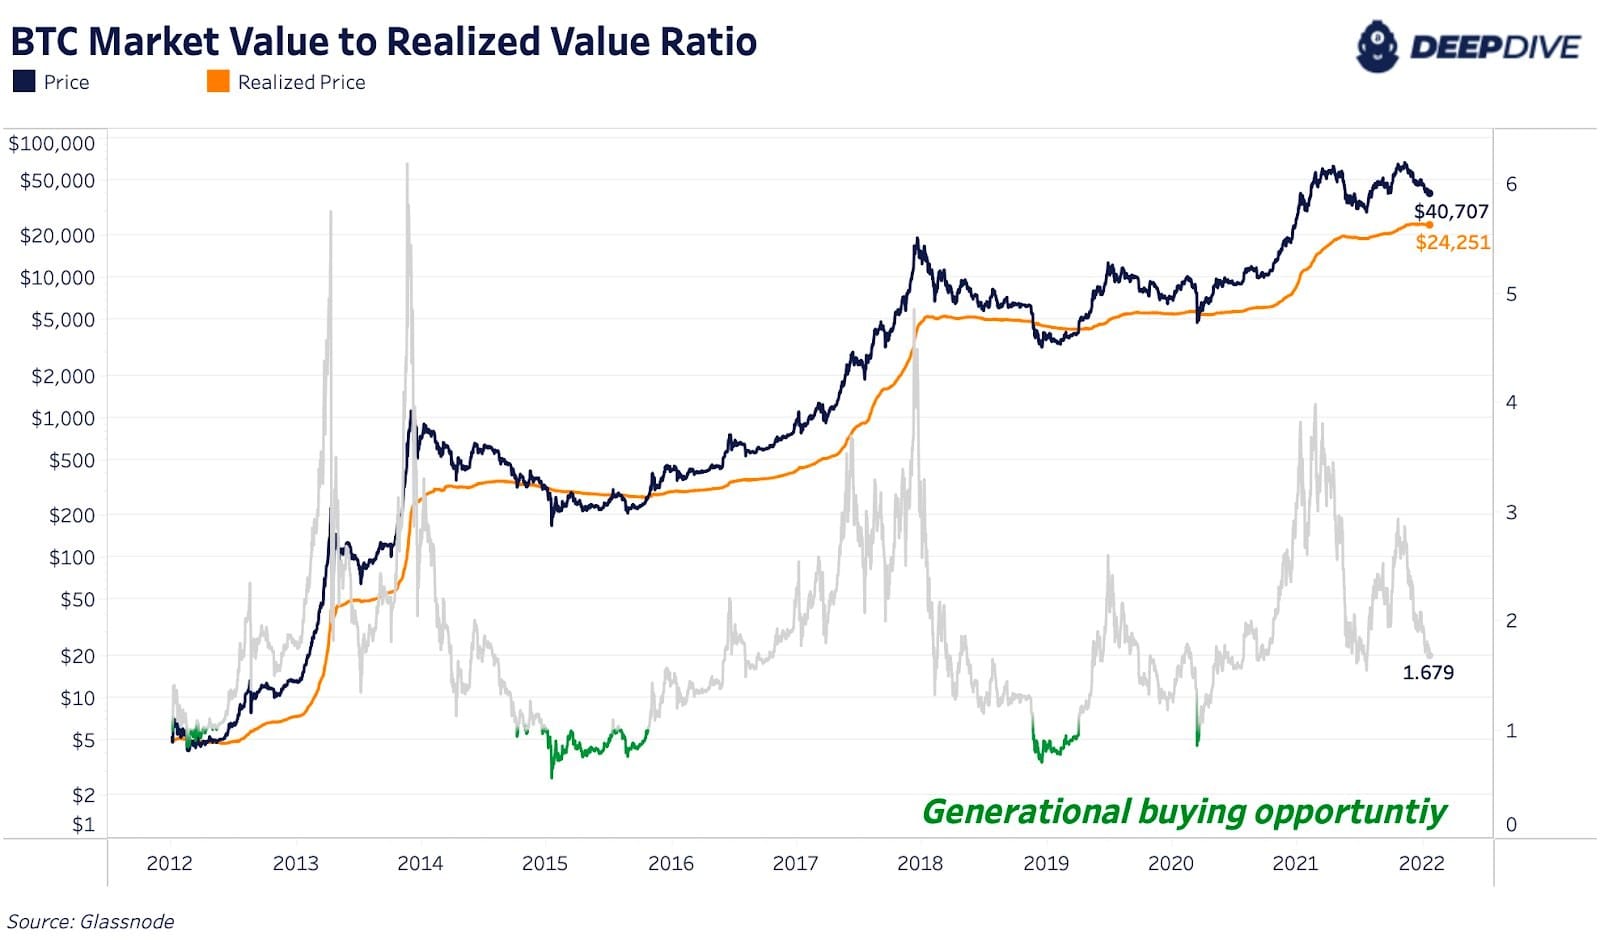
It is the average price at which every Bitcoin currently held was actually acquired — the aggregate cost basis of the entire market. When the traded price falls beneath it, the average holder is underwater. Historically, that condition has not lasted long.
On this measure, the generational level sits somewhere around $24,000 to $25,000. We are not there. We are considerably closer than at the roughly $69,000 highs of late last year — but closer is not the same as arrived, and the level may never be reached in this cycle.
Buy when there is blood in the streets, even if the blood is your own.
The difficulty is built into the advice. The further Bitcoin falls, the better the entry — and the harder it becomes to act. That tension is not solved by charts; it is solved by deciding in advance how much you are willing to commit at which level, before the level arrives.
The 200-Week Moving Average
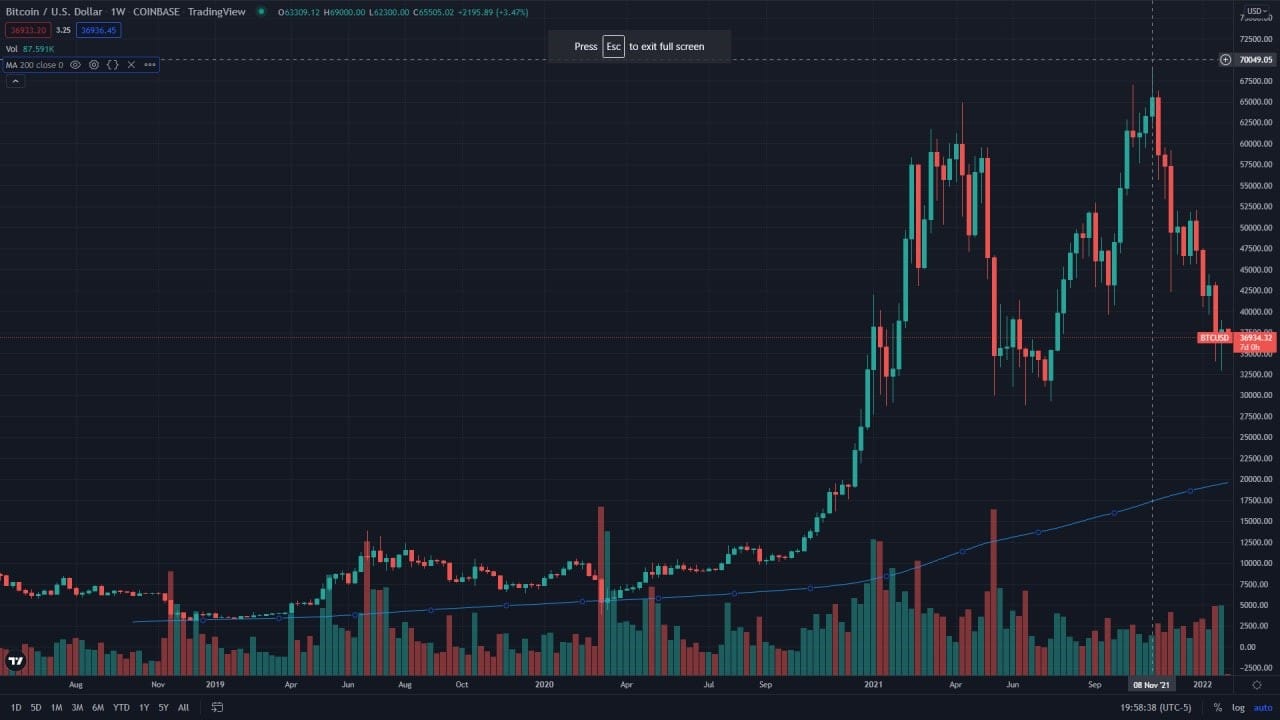
A second long-horizon reference. The weekly chart with its 200-week moving average has touched that line exactly twice — in 2018 and in March 2020. Both, in retrospect, were exceptional entry points.
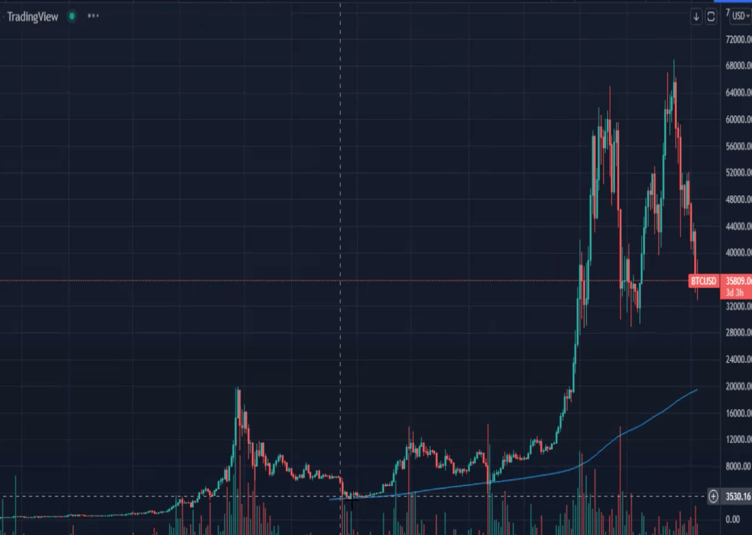
From the current level near $36,000, reaching that average would mean a further substantial decline. It looks possible. If it happens, history suggests it would be worth paying attention to.
Who Controls the Trend
Valuation tells you whether something is cheap. It tells you nothing about whether it has stopped falling. For the second question, Heikin-Ashi candles are more useful than a conventional price chart — they smooth the noise and display direction rather than each individual move.
An Alternative Valuation Read
One more angle, weighting price by the number of coins moved and how long they had been held — a measure of whether the market is running hot or cold.
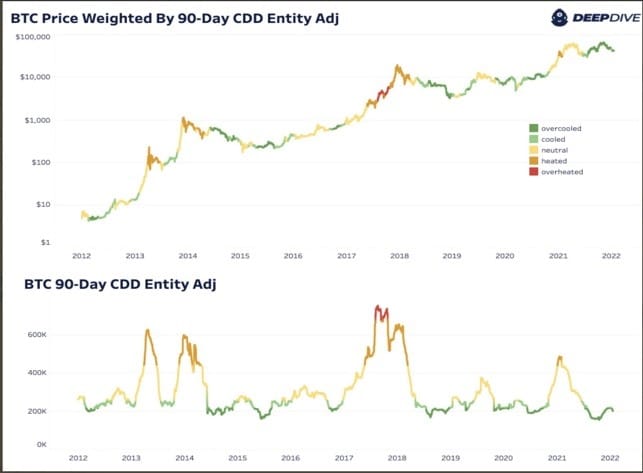
The red zones mark periods when the market overheated on strong demand. Nothing in the present price action resembles that. By this measure we are in the over-cooled range — which is the condition in which entry points have historically appeared, though not the condition in which they feel appealing.
Where This Leaves Us
The reasonable expectation is further discomfort over the coming months for Bitcoin holders. At some point the market turns; that point is not identifiable in advance.
And an important qualification the charts themselves make plain: entering at a level that was historically good value has never guaranteed it would not become better value still. Buying near a floor and then watching the position fall further is an ordinary outcome, not an unusual one.
Which returns us to the unglamorous parts. Think about risk before return. Size the position so that being wrong about the timing is survivable. And do not put all the eggs in one basket, however compelling the basket appears.
None of the above constitutes financial advice or a recommendation of any asset or strategy. Digital assets are highly volatile and may lose their entire value. Charts reflect conditions at the time of writing and past patterns do not predict future outcomes. If you would like guidance specific to your circumstances, please contact us directly. Investing involves risk, including the possible loss of principal.
Sized Correctly, Held Properly
Sovereign Digital manages digital asset allocations under a dedicated Virginia licence. The question we start with is not whether to own any, but how much belongs in a portfolio that has other work to do.
заказать звонок →